The Fletcher Munson curve: what is it and why should you care?

Discover what the Fletcher Munson curve equal loudness contours are all about, and what implication they have every piece of music you make
You might have come across the term Fletcher-Munson curve, or Fletcher-Munson effect on your quest to become a better producer. If you took one look at the complexity of the subject and decided to return to the safety of your DAW, you wouldn’t be the first, and there’s no shame in that.
We’re here to distill the ocean of information on the Fletcher-Munson curve, and give practical suggestions on how you can use it to make better mixing and mastering decisions. Speaking of which, if you want to learn how to mix a track in under an hour, check out The One Hour Mixing Workflow.
What is the Fletcher-Munson curve?
In the early 1930s, physicists Fletcher and Munson published a paper which outlined their findings on the relationship between perceived loudness and frequency. One key takeaway was the development of the Fletcher-Munson curve, also known as an equal loudness contour. In the 90 years since its conception, there have been some updates to Fletcher and Munson’s original findings owing to scientific and technological advances, but the premise remains.
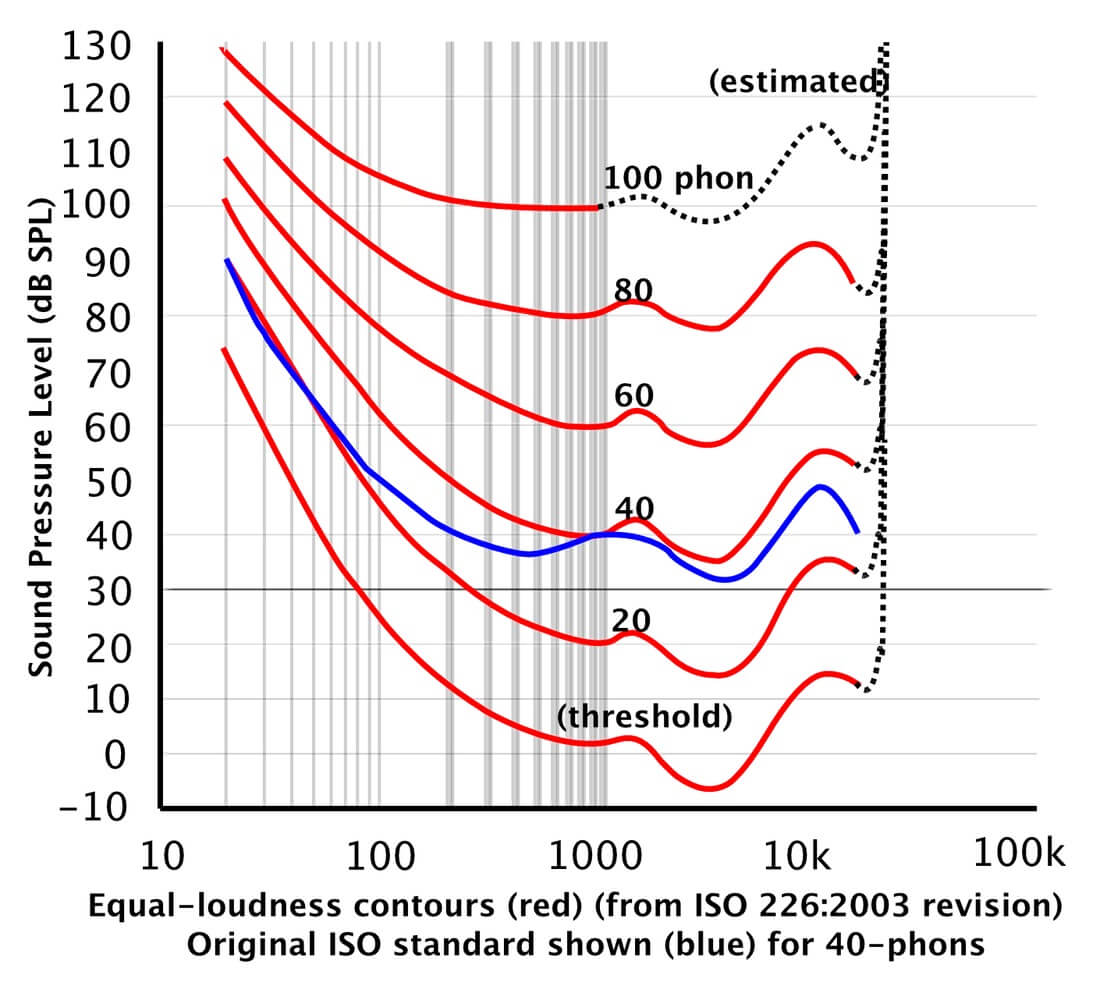
The Fletcher-Munson curve is a visual representation of the relationship between any given frequency and its perceived loudness. It is based on experimental research conducted nearly a century ago, which found that the human’s perception of loudness is dependent on a sound’s frequency content. In even simpler terms, when we listen to two sounds at different frequencies but at the same dB level (Sound Pressure Level), we may not perceive those sounds to be the same loudness.
The Fletcher-Munson curves demonstrate this psychoacoustic concept in visual terms. The curves show the level in dB at which any given frequency needs to be played in order to be perceived at the same level. For example, for a 100Hz tone to sound the same as a 1000Hz tone at 50dB, the 100Hz tone would actually need to be played at approximately 68dB.
The not-so-simple answer
If you’re thinking that a sound must just be as loud as it is, regardless of frequency, that would be a fair assumption. We’re not really talking about how loud a sound is though, but how loud we perceive a sound to be. To understand this fully, we need to look beyond the graph and into our ears and brain. The physical shape of our inner-ear and the way it transmits sound to our brain are responsible for the way in which we interpret volume and frequency, but we aren’t biologists so that’s just about as far as we can go into that.
To make matters more confusing, the variance in our perception of a sound’s level according to frequency, also depends on the level at which a sound is played. Again, this is communicated in the graph by the 13 non-parallel lines at the various dB levels. At lower levels, there is an extreme variance in our perception of volume according to frequency. At higher levels, the variance is reduced.
The other interesting point on the chart appears at around 2kHz to 4kHz across all dB levels. It shows that sounds within this frequency range don’t need to be as loud in order to be perceived as being the same level. In other words, our ears are much more sensitive to sounds in this frequency range. This is because of resonances within the ear canal that amplify this frequency range, which some believe is an evolutionary characteristic; this is the frequency inhabited by human dialogue, including screaming and crying.
What does the Fletcher-Munson curve mean?
Armed with your new-found knowledge on equal loudness contours, we can start to use this information to inform our mixing and mastering decisions, and even our sound design and sample selection.
Sound design and sample selection
We can deduce from the equal loudness contour that if the end goal is to have a tonally balanced mix, we must be sparing with any unnecessary elements that occupy the 2kHz to 4kHz range. This poses a slight issue, as vocals, piano, synths and snares are all likely to fall partly within this region.
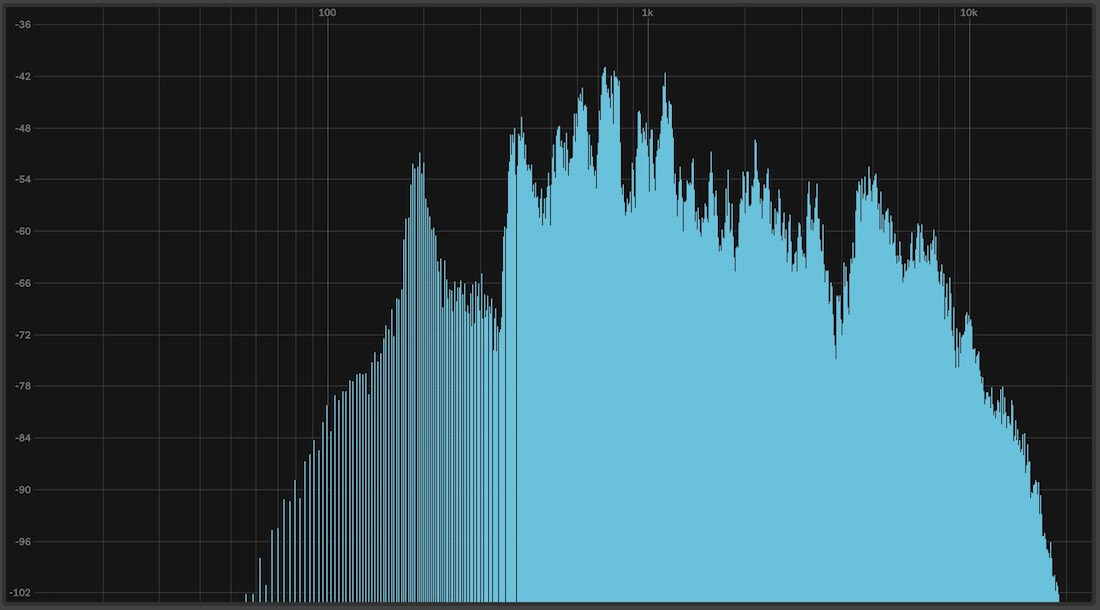
All of this tells us that we need to pay particular attention when mixing these elements, not only to give each of them their own space within the mix, but to avoid giving listeners a mix that they perceive to be overpowering in this frequency range.
Context is key
It’s important to consider the end-audience and setting for your productions. It should go without saying that you’d mix an ambient album differently to a techno EP, but how does the Fletcher-Munson curve play into that?
It’s safe to assume that ambient music is likely to be consumed at conservative levels on a domestic playback system such as earphones or a hi-fi. While this is partially true for techno, it might be safer to mix it as if it’s going to get turned up to 11 on a club sound system.

With that in mind, it would be appropriate to mix ambient at a reasonable listening level, safe in the knowledge that it will translate well to the listener. With techno on the other hand, one should be conscious to not blindly crank up the bass because it can’t be heard on a small set of studio monitors, as humans are more sensitive to bass as the dB SPL increases.
Try not to obsess too much
Contrary to all of the points raised above, try not to get bogged down with catering your entire mix or master according to an equal loudness contour. Ultimately, all of your calculations and fine tuning can be undone by adjusting the volume. On top of that, every playback system has a different frequency response, and even the physical variances between peoples’ ears will impact how someone interprets volume and frequency. The Fletcher-Munson curve should serve only to loosely inform the overall tone of a mix, and is by no means the final word in achieving the perfect tonal balance.
What’s next?
If you want to learn how to harness loudness in your own productions, check out Jason Herd’s Loudness in Music Production course.
